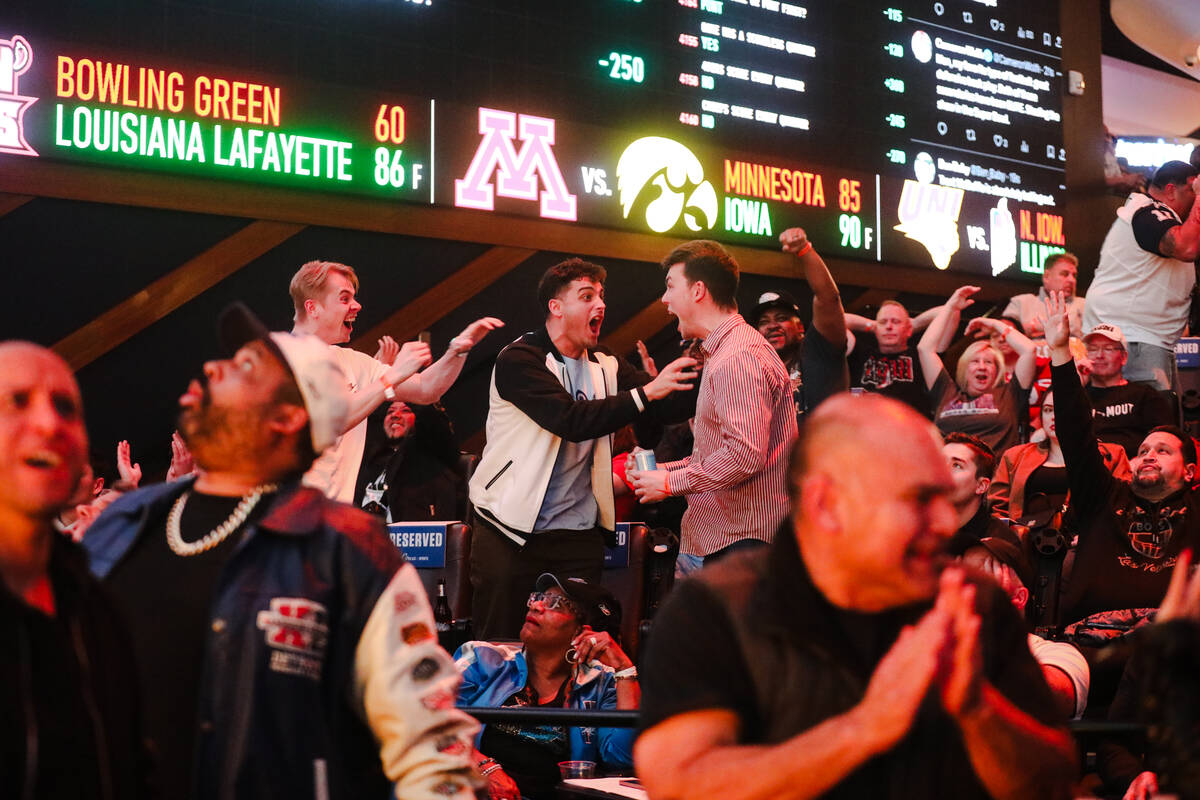
How much money have Nevada sportsbooks won on each Super Bowl?

The Nevada Gaming Control Board has tracked the state’s betting history on the Super Bowl since 1991.
Here are the Super Bowl betting handles, or the amount of money wagered on each game, and the amounts won or lost by the state’s sportsbooks each year:
Year; Betting handle; Win amounts; Hold (win percentage); Result
1991; $40,080,409; $3,512,241; 8.8%; New York Giants 20, Buffalo 19
1992; $50,334,277; $301,280; 0.6%; Washington 37, Buffalo 24
1993; $56,811,405; $7,174,869; 12.6%; Dallas 52, Buffalo 17
1994; $54,483,221; $7,481,541; 13.7%; Dallas 30, Buffalo 13
1995; $69,591,818; $(-396,674); -0.6%; San Francisco 49, San Diego 26
1996; $70,907,801; $7,126,145; 10.1%; Dallas 27, Pittsburgh 17
1997; $70,853,211; $2,265,701; 3.2%; Green Bay 35, New England 21
1998; $77,253,246; $472,033; 0.6%; Denver 31, Green Bay 24
1999; $75,986,520; $2,906,601; 3.8%; Denver 34, Atlanta 19
2000; $71,046,751; $4,237,978; 5.9%; St. Louis 23, Tennessee 16
2001; $67,661,425; $11,002,636; 16.3%; Baltimore 34, N.Y. Giants 7
2002; $71,513,304; $2,331,607; 3.3%; New England 20, St. Louis 17
2003; $71,693,032; $5,264,963; 7.3%; Tampa Bay 48, Oakland 21
2004; $81,242,191; $12,440,698; 15.3%; New England 32, Carolina 29
2005; $90,759,236; $15,430,138; 17.0%; New England 24, Philadelphia 21
2006; $94,534,372; $8,828,431; 9.3%; Pittsburgh 21, Seattle 10
2007; $93,067,358; $12,930,175; 13.9%; Indianapolis 29, Chicago 17
2008; $92,055,833; $(-2,573,103); -2.8%; N.Y. Giants 17, New England 14
2009; $81,514,748; $6,678,044; 8.2%; Pittsburgh 27, Arizona 23
2010; $82,726,367; $6,857,101; 8.3%; New Orleans 31, Indianapolis 17
2011; $87,491,098; $724,176; 0.8%; Green Bay 31, Pittsburgh 25
2012; $93,899,840; $5,064,470; 5.4%; N.Y. Giants 21, New England 17
2013; $98,936,798; $7,206,460; 7.3%; Baltimore 34, San Francisco 31
2014; $119,400,822; $19,673,960; 16.4%; Seattle 43, Denver 8
2015; $115,986,086; $3,261,066; 2.8%; New England 28, Seattle 24
2016; $132,545,587; $13,314,539; 10.1%; Denver 24, Carolina 10
2017; $138,480,136; $10,937,826; 7.9%; New England 34, Atlanta 28 (OT)
2018; $158,586,934; $1,170,432; 0.7%; Philadelphia 41, New England 33
2019; $145,939,025; $10,780,319; 7.4%; New England 13, Los Angeles 3
2020; $154,679,241; $18,774,148; 12.1%; Kansas City 31, San Francisco 20
2021; $136,096,460; $12,574,125; 9.2%; Tampa Bay 31, Kansas City 9
2022; $179,823,715; $11,063,412; 6.2%; Los Angeles 23, Cincinnati 20
2023; $153,183,002; $4,361,646; 2.8%; Kansas City 38, Philadelphia 35
2024; $185,612,813; $6,802,264; 3.7%; Kansas City 25, San Francisco 22 (OT)
Contact reporter Todd Dewey at tdewey@reviewjournal.com. Follow @tdewey33 on X.


